Python Training by Dan Bader

Monitoring your Node.js app with Datadog

This is a tutorial about how to instrument a Node.js app with realtime metrics. We’ll use Datadog as a backend to do the monitoring together with the datadog-metrics library.

At Mobify we ran a couple of web services that we monitored in production using Datadog. It’s a great tool to whip up dashboards quickly and gain insights into the key performance metrics of your application. Datadog also lets you to set up alerts on these metrics so you can use it to monitor application health, too.

Datadog example screenshot

Datadog-metrics

Datadog has good Python client libraries but it’s Node.js support was somewhat lacking. I was unhappy with having to set up a statsd instance to report metrics from Node.js apps and decided to write a library called datadog-metrics to solve that problem.

Datadog-metrics let’s you report metrics directly from your Node.js app to Datadog’s HTTP API without having to setup and maintain a statsd instance. It handles the details like aggregation and buffering (we don’t want to send one HTTP requests for every single metric we report), and provides utilities for things like computing histograms. They help answer questions like “What’s the average and 95th percentile request time for this app?”.

Let’s put together a simple example application that reports some memory statistics into a Datadog dashboard using datadog-metrics.

Step 1: Create a Datadog account

Datadog has a free account tier that let’s you monitor up to 5 hosts, and that’s all we need for this tutorial. You can sign up for a free account here.

After you’ve signed up we need to grab the Datadog API key. You can find the API key under Integrations » APIs. You only need the API key to set up datadog-metrics, not the App key.

Step 2: Integrate datadog-metrics in your app

Next up, we’re going to install the datadog-metrics library and integrate it with our application. To demonstrate how that works we’ll create a simple demo app that reports some memory stats to Datadog.

Let’s start with installing datadog-metrics via NPM:

$ npm install --save datadog-metrics

Now save the following JavaScript code into a file called example_app.js:

var metrics = require('datadog-metrics');
metrics.init({ host: 'myhost', prefix: 'myapp.' });

function collectMemoryStats() {
    var memUsage = process.memoryUsage();
    metrics.gauge('memory.rss', memUsage.rss);
    metrics.gauge('memory.heapTotal', memUsage.heapTotal);
    metrics.gauge('memory.heapUsed', memUsage.heapUsed);
    metrics.increment('memory.statsReported');
}

setInterval(collectMemoryStats, 5000);

That’s all it takes to report some basic metrics with datadog-metrics. Now let’s spin up the app with the following shell command. Make sure that DATADOG_API_KEY is set to the API key we’ve copied from the Datadog admin console in step 1:

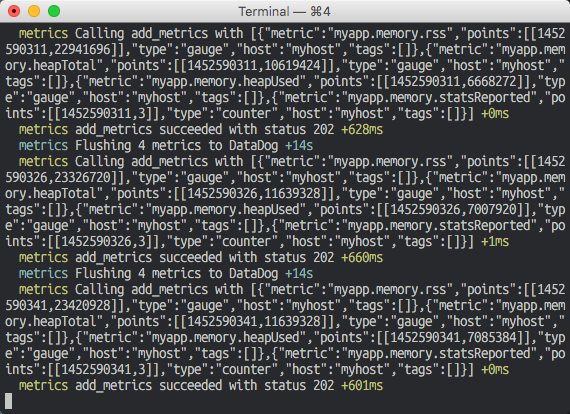
$ DATADOG_API_KEY=YOUR_KEY DEBUG=metrics node example_app.js

If you let this run for a little while your console output should look similar to this. That means we’re now sending metrics to Datadog:

Console output

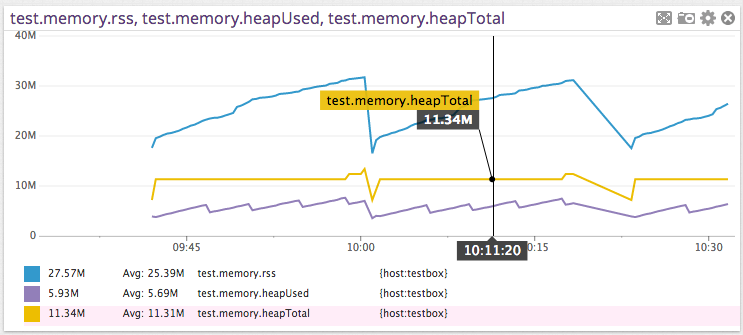
After a short delay you should start seeing metrics show up in Datadog’s Metrics Explorer. Just type the key prefix we’ve used in the metrics.init() call (myapp.) into the Graph input box and you should see a list of metrics reported by our app. Click any metric and Datadog will show you a line plot for that metric by default.

Once you see metrics are reported correctly to Datadog we can go ahead and set up a nice little dashboard.

Step 3: Build a sweet, sweet dashboard

Time boards vs Screen boards

Datadog’s web UI offers two kinds of dashboards–Time boards and Screen boards.

Time boards manage their own layout and you can only place graphs in them. They’re good at throwing together a few metrics that you want to track or compare to each other. Screen boards on the other hand offer you complete control over the layout via a drag-and-drop interface. They also provide several widget types you can use to visualize your data.

I recommend going with a Screen board unless you’re just exploring your data.

Screenboard selection

Setting up a Screen board

To create a new Screen board open the dashboard list view and click Create Dashboard. Type in a name for the board like “My Test Board”, select ScreenBoard, and then click Create.

We’re going to set up two simple widgets now: a Graph to plot the value of memory.heapUsed over time, and a Query Value that shows us the latest value of memory.statsReported.

Let’s start with the Graph for memory.heapUsed.

You should see a gray frame listing available widget types in the upper part of the dashboard editor. Click and drag the Graph widget into the checkerboard area below.

Widget selector

A Graph Editor window opens where we can configure the widget. Under Choose metrics and events click the yellow select box next to the word Get. You should see a list of available metrics select (or type in) myapp.memory.heapUsed. Click Done to close the widget editor. You should now see a plot with memory stats on your dashboard.

Graph widget

Next up is the Query Value widget for the memory.statsReported counter.

Find the Query Value widget in the list of available widgets and drag it into the dashboard area below. In the Query Value Editor window that opens, select myapp.memory.statsReported under Choose a metric.

Counters in Datadog

The value displayed should be around 3. This is what we expect the value of this counter to be–we have a flush interval of 15 seconds and we increment the counter every 5 seconds in the setTimeout callback.

It can be a bit confusing how counters work in Datadog at first.

You just need to remember that they only count events that happen from one flush interval to the next. This makes them useful for measuring throughput. For example, the number of API responses served per time interval.

Adding some conditional formatting

For our little example app we know that the value of memory.statsReported should be around 3 if the app is healthy. So let’s add some color highlighting to this widget via the Conditional Formatting section. Modify the default rule to be:

If value is < than 2.5 show with Red background,
Else if >= than 3 show with Green background.
Query widget

Completing our dashboard

Click Done to save the widget configuration.

Back in the dashboard editor, click Save Changes to leave the editor.

Congratulations, you just created your first Datadog dashboard, with real metrics from a NodeJS app! The dashboard should look something like this:

Final Datadog screen board

This should be enough to get you started! It’s easy to go from there and expand your Dashboard with more metrics and other widgets. I found it helpful to simply explore and play with the different widget types offered by Datadog until you arrive at a set up that makes the most sense for your app and the metrics you care about.

<strong><em>Improve Your Python</em></strong> with a fresh 🐍 <strong>Python Trick</strong> 💌 every couple of days

Improve Your Python with a fresh 🐍 Python Trick 💌 every couple of days

🔒 No spam ever. Unsubscribe any time.

This article was filed under: javascript, programming, side-project, and web-development.

Related Articles:
Latest Articles:
← Browse All Articles